
By Scott Whelan
Good morning,
I’m starting to feel the San Francisco market slow below $3M. A few months ago, even homes that needed work or were still in original condition sold quickly. Now buyers are giving those homes a closer look.
October’s closed sales still show substantial competition, but those deals were negotiated earlier. What I’m watching in November is how buyers respond to homes coming on the market now.
Among single-family homes originally listed between $1M and $1.5M, the median sale price was 142% of asking, and 95% closed above list. For condos and townhouses, the highest median sale-to-list ratio was 118%, for properties originally listed between $1.5M and $2M.
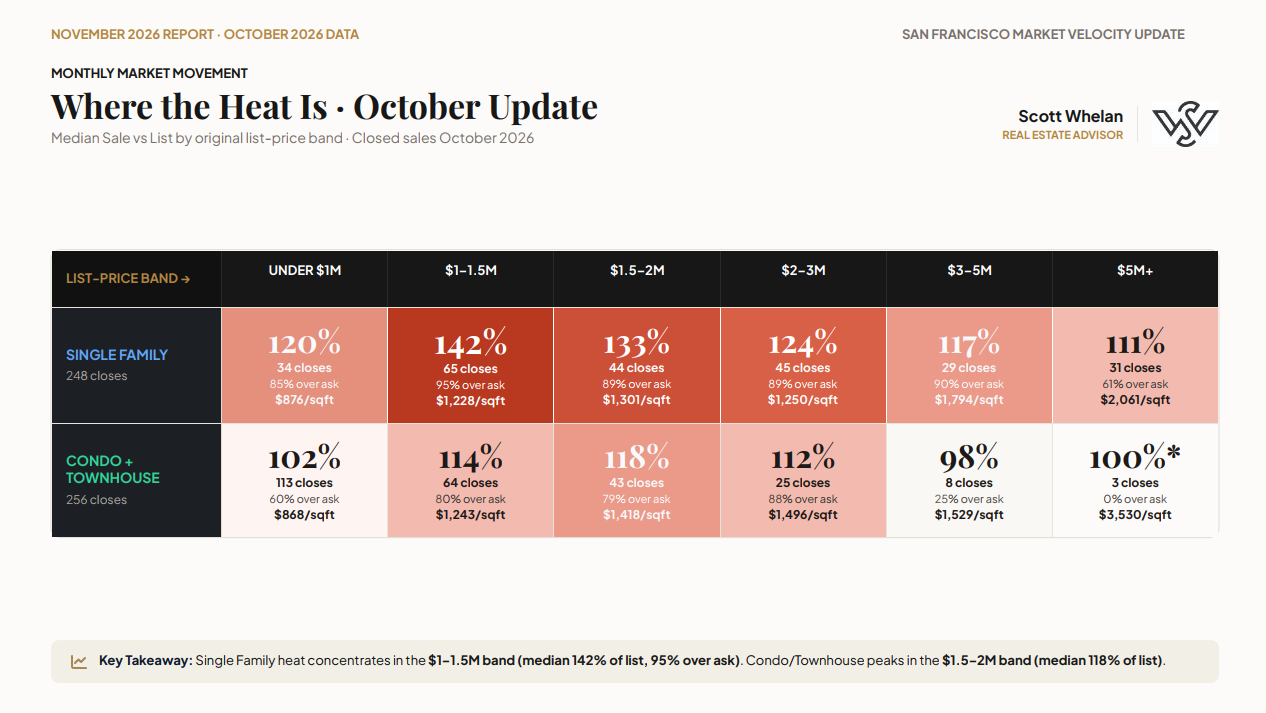
Keep in mind that asking price is a marketing decision. A house that sells for 142% of asking tells you something about the seller’s starting price and the competition for that home. Measuring appreciation takes a comparison with earlier sales.
A million over asking has become far more common
In the original October 16 MLS snapshot, 252 San Francisco residential sales had closed at least $1 million above asking since January 1. The previous high for the same period was 41, in 2022.
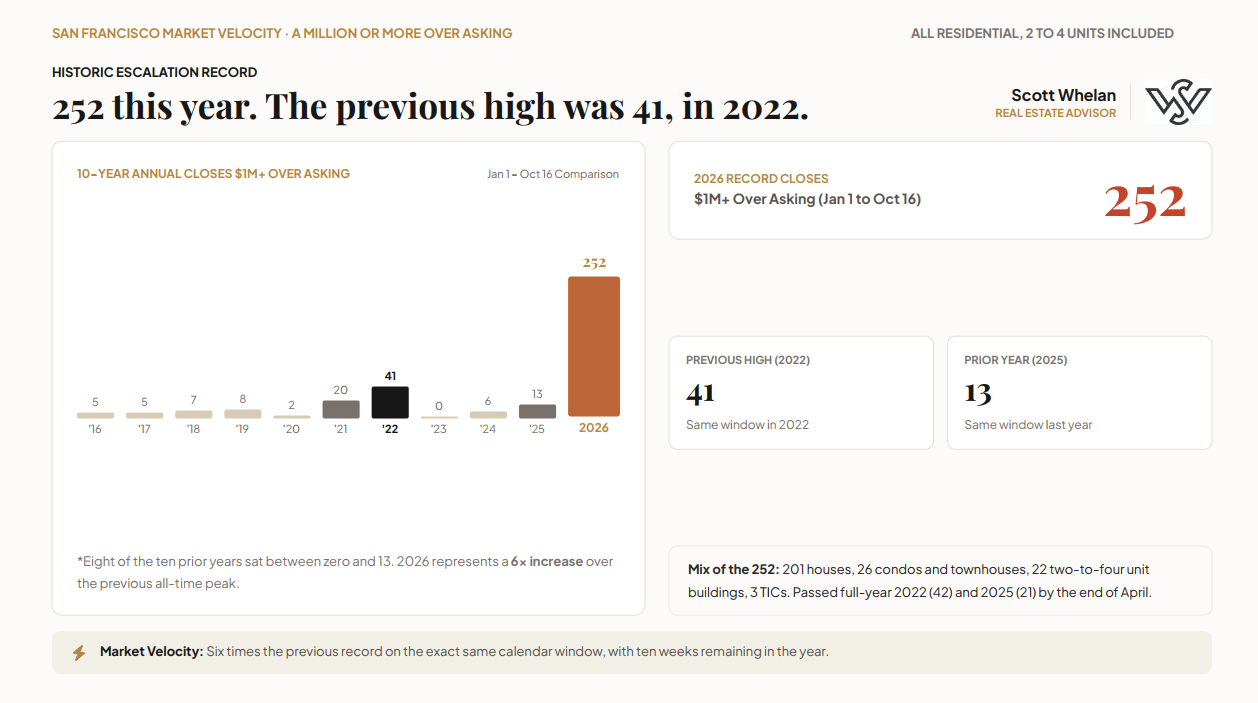
That total includes several property types. Looking just at houses, 32 of 96 sales in Noe Valley cleared $1M over asking. In the Inner Richmond, it was 10 of 22. In the Lake Street area, labeled “Lake” in the chart, it was 6 of 18.
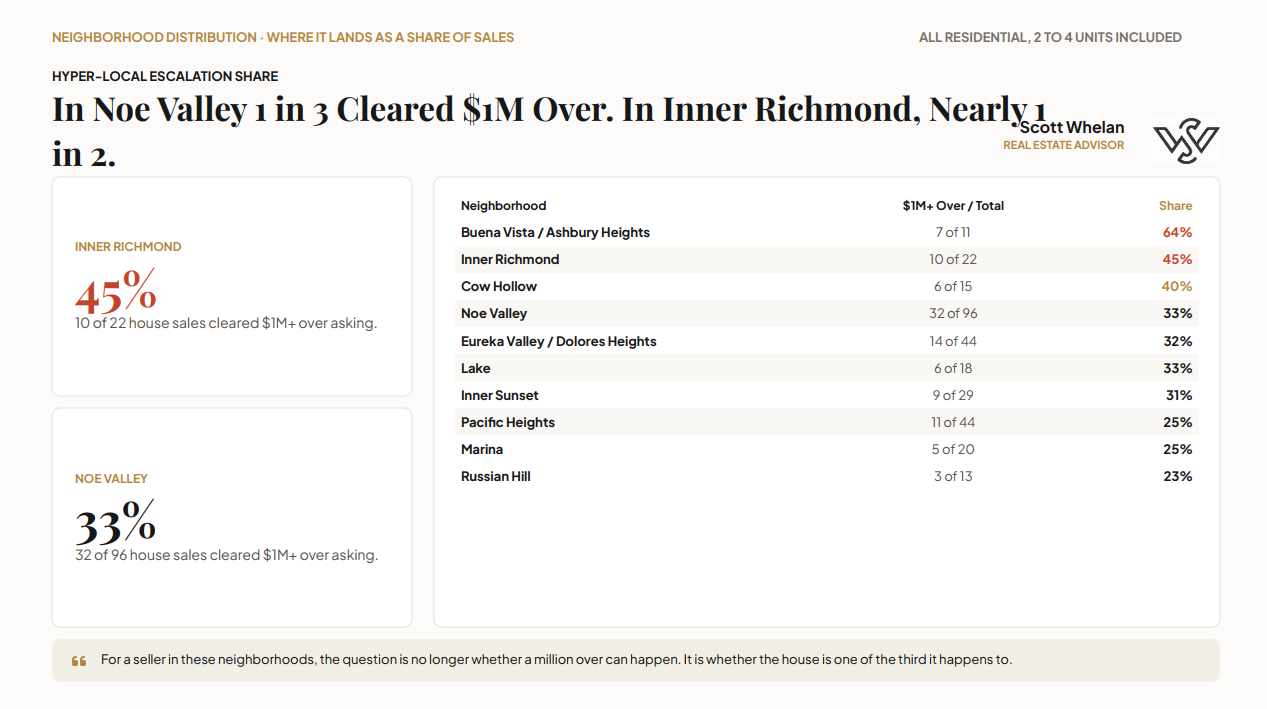
That is substantial competition, although it is not a promise of what any individual seller should expect. The starting price, condition of the property and alternatives available to buyers all influence the outcome.
You do not have to be a cash buyer to participate
The 2026 house-sales data also offers some perspective for financed buyers. Cash accounted for 20% of purchases below $1.5M, 27% between $1.5M and $2M, and 28% between $2M and $3M. In each of those ranges, most completed purchases involved financing.
Cash becomes more prevalent at higher prices: 55% of purchases between $4M and $6M, and 69% at $6M and above.
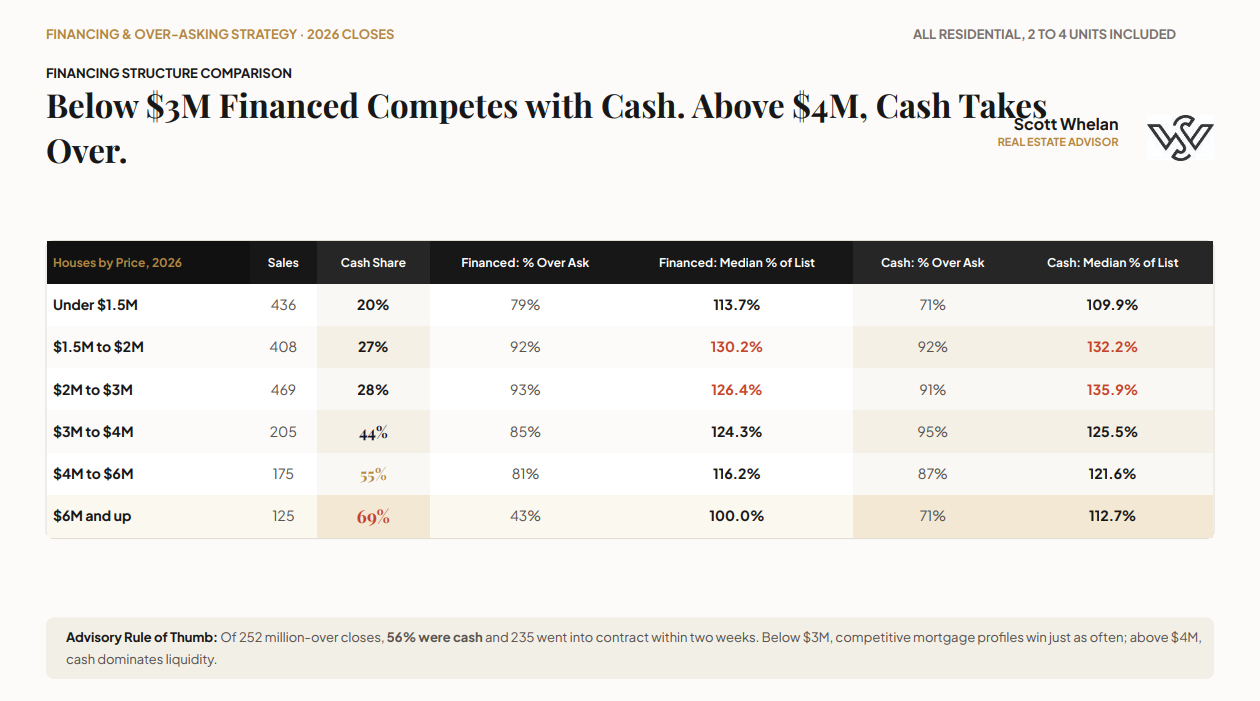
That does not tell us which offer will win a particular property, but it does put the idea that “everyone is paying cash” into perspective.
Where Americans are moving by generation
California’s population fell 0.5% between April 2020 and July 2025, while the U.S. population grew 3.1%, according to Census estimates. Separately, California recorded the largest net loss of one-way U-Haul customers of any state for the sixth consecutive year in 2025.
That makes the generational breakdown particularly interesting. U-Haul’s 2026 Midyear Migration Trends National Report shows how differently the generations are choosing where to live—and where California continues to attract younger movers. The report covers July 2025 through June 2026 and ranks states and metros by their net gain of one-way U-Haul equipment.
Baby Boomers: South Carolina and North Carolina topped the state rankings, followed by Florida and Arizona. Their leading destinations were concentrated in the Southeast.
Gen X: Florida ranked No. 1, followed by Texas, South Carolina, Tennessee and Alabama. San Diego, at No. 9, was the only California metro in this generation’s top 10.
Millennials: Florida, Texas and California led the state rankings. Dallas–Fort Worth, Houston and Orlando were the top metros, followed by the San Francisco Bay Area at No. 4. Boise also made the top 10. Ohio, Indiana, Minnesota and Wisconsin appeared among the leading states; U-Haul attributes the Midwest interest to career moves.
Gen Z: Texas and California led the state rankings, followed by New York and Illinois. New York City, Dallas–Fort Worth and Chicago were the top metros, followed by the San Francisco Bay Area at No. 4 and Los Angeles at No. 5.
For San Francisco, the younger generations are the part of this report worth watching. Despite California’s overall population decline over the Census period and its continued U-Haul net outflow, the state remains a leading destination for younger U-Haul movers. The Bay Area’s position among both millennials and Gen Z adds useful perspective to the discussion of longer-term housing demand.
These reports measure different things over different periods: Census estimates track total population change, while U-Haul tracks its customers’ moves. The Bay Area rankings also cover the broader region, rather than San Francisco homebuyers specifically.
That is it for now. If you’re a owner wondering whether the first half of '27 is the time to capitalize on some of the extraordinary sale prices we've seen, or a buyer looking for a new perspective on how to tackle this market, give me a call. Sometimes a conversation is the best place to start.
Call or email anytime.